An important detail: this is not a regular investment plan
It's worth being precise on this point, because it's at the heart of the strategy: the additional capital was not paid in on a regular schedule (monthly or quarterly, as in a classic regular investment plan). The portfolio is monitored quarterly, but new capital is only paid in when rebalancing calls for it — that is, only when equities, after a market fall, drop below the lower edge of the target band.
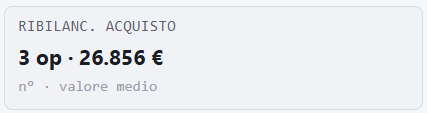
Over ten years, this happened only 3 times: around 2001, 2002 and 2008 — precisely the moments when equity markets were at their lows. The rebalancing mechanism therefore acted as a disciplined trigger to buy equities exactly when they were cheaper, with no need for any forecasting or deliberate market timing.
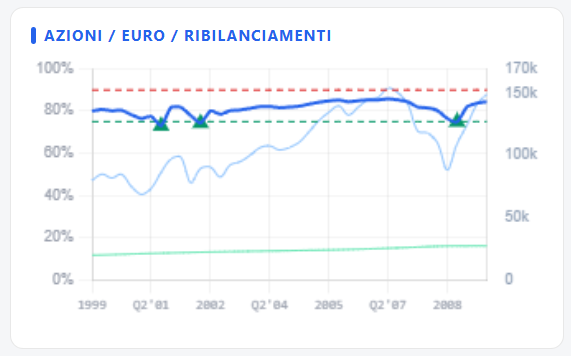
The three green arrows mark the moments when the equity allocation (dark blue line) fell below the target band, triggering a purchase with fresh capital.
The numbers compared
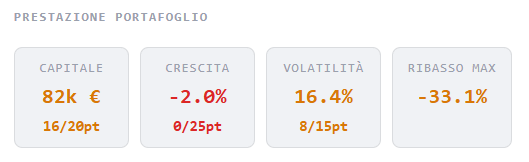
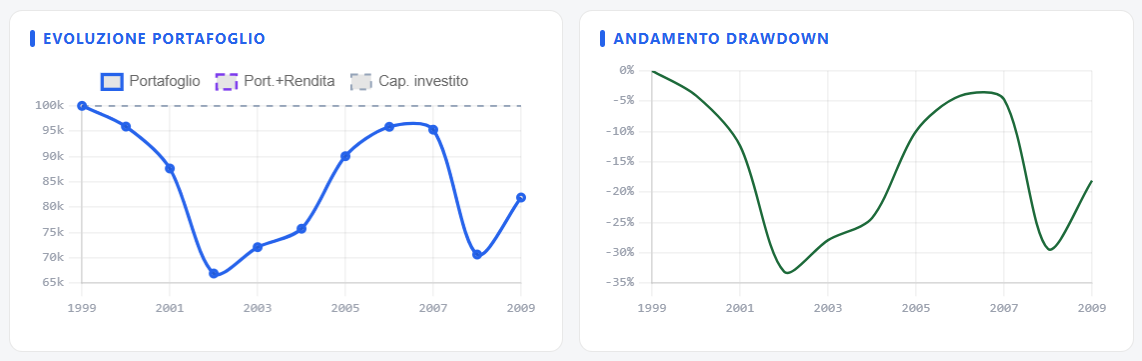
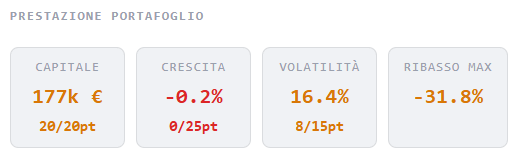
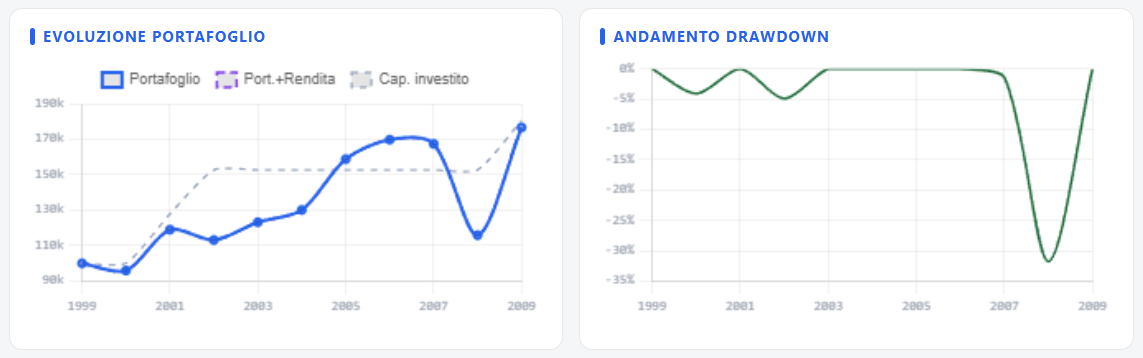

| Scenario | Final capital | Annual growth (CAGR) | Volatility | Maximum drawdown |
|---|---|---|---|---|
| Static 80/20 | €82,000 | -2.0% | 16.4% | -33.1% |
| 80/20 with rebalancing | €177,000 | -0.2% | 16.4% | -31.8% |
Detail of the 3 rebalancing operations: average value of €26,856 per operation, for a total of €80,568 in additional capital paid in over the decade (drawn from an emergency fund dedicated to the portfolio).
How to read these numbers without being misled
The jump from €82,000 to €177,000 in final capital is huge, but it isn't all down to the strategy: much of that difference is simply the additional capital paid in (€80,568) plus its return. Comparing the two final values "at a glance" would be misleading, since one scenario received more than double the capital invested in the other.
In other words: for the same amount of market risk taken, the discipline of buying equities exactly when their weight in the portfolio was collapsing — that is, when they were cheaper — noticeably improved the return on every euro actually invested.
The practical lesson
Rebalancing is often presented as a simple risk-control tool: bringing the portfolio back to its target allocation after markets have shifted it. This case shows a second, less discussed but equally relevant benefit: if rebalancing is done by injecting new capital rather than selling existing assets, it also becomes an automatic mechanism for buying at a discount during downturns — with no need to guess when the right moment is. It's the market itself, through the allocation drifting away from the target band, that signals when to act.
It's worth being equally clear about this: it only works if you actually have capital available (in this case, a dedicated emergency fund) at moments of crisis — which is far from guaranteed, since market crises often coincide with periods of uncertainty on a personal and professional level too. Planning for this liquidity in advance is an integral part of the strategy, not a minor detail.
Simulate rebalancing on your own portfolio
Want to see the effect of rebalancing with your own thresholds and time horizon? Try our free ETF Backtest.
Go to the ETF Backtest →