The four scenarios compared
| Allocation | Final capital | Annual growth (CAGR) | Volatility | Maximum drawdown |
|---|---|---|---|---|
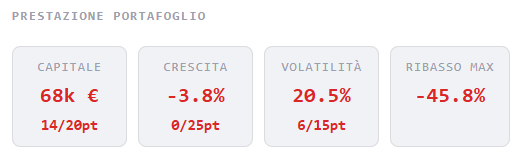
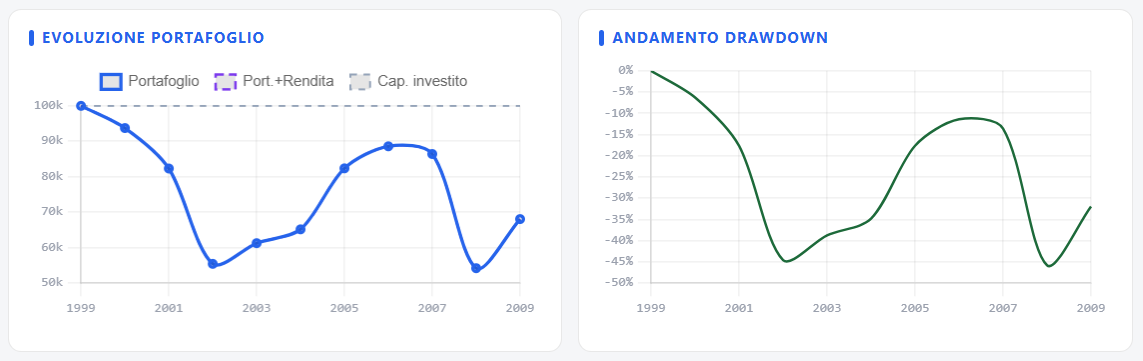
| 100% Global Equities | €68,000 | -3.8% | 20.5% | -45.8% |
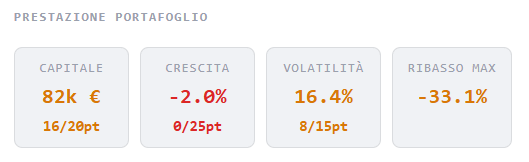
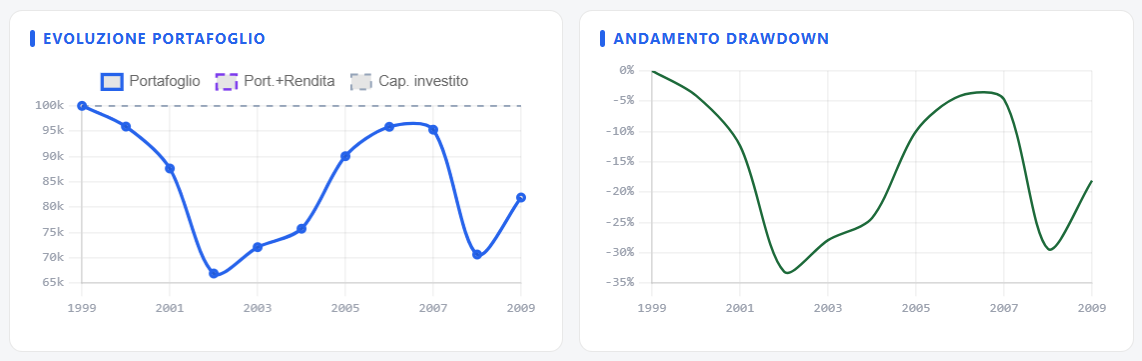
| 80% Equities / 20% Cash | €82,000 | -2.0% | 16.4% | -33.1% |
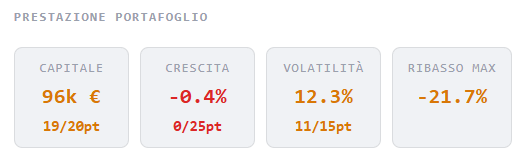
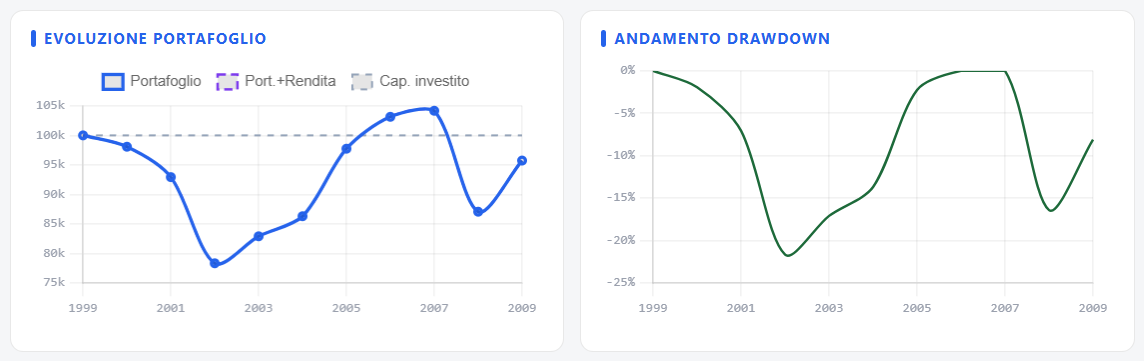
| 60% Equities / 40% Cash | €96,000 | -0.4% | 12.3% | -21.7% |
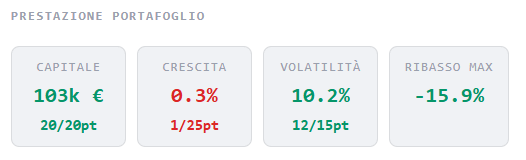
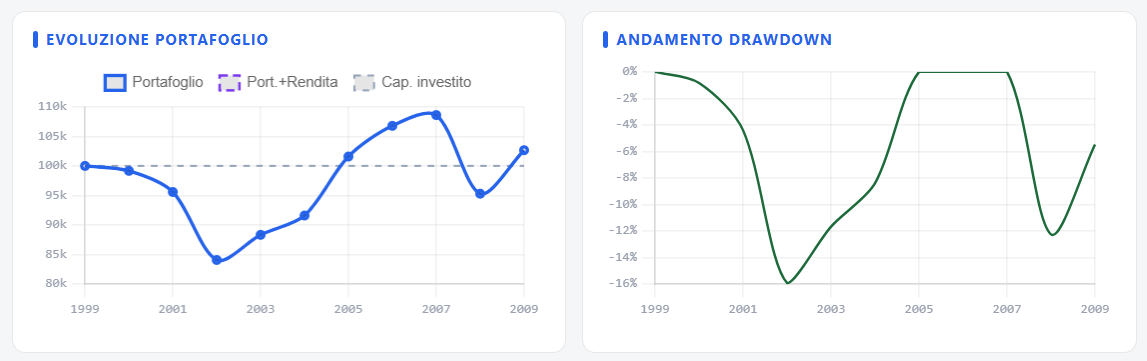
| 50% Equities / 50% Cash | €103,000 | +0.3% | 10.2% | -15.9% |
The numbers speak for themselves: an investor who stayed 100% in global equities for the entire decade ended the period with 32% less capital than at the start, with an intermediate maximum drawdown of 45.8% — meaning that, at one point, nearly half of their wealth had disappeared on paper. Only the most conservative portfolio, the 50/50, managed to close the decade slightly in positive territory, with a maximum drawdown less than half that of the 100% equity portfolio.
Why the cash allocation made the difference
It's no coincidence that the gap between the four scenarios is so wide. During sharp market downturns, a cash or short-term bond allocation doesn't just deliver a different return: it reduces the maximum drawdown and therefore the risk of having to sell equities at the worst possible moment, whether out of personal necessity or simple panic in the face of a -45% loss.
Looking at the two crashes separately:
- 2000-2002 (dot-com bubble): global equities lost around 45% from their peak, a slow but drawn-out decline lasting nearly three years.
- 2007-2009 (financial crisis): the fall was faster and just as severe, followed however by a strong recovery in the early 2010s.
Portfolios with a higher cash allocation cushioned both blows, arriving at the post-2009 recovery with more of their capital intact — and therefore with more "fuel" to benefit from the subsequent market rebound.
The point isn't predicting crises, but being ready
None of the four simulated portfolios anticipated the arrival of the two crises: the allocation was fixed at the start of the period and never changed. That is precisely the point of this exercise — it's not about guessing when the next crisis will hit, but about choosing in advance an allocation consistent with how much drawdown you're willing to tolerate, knowing that a difficult decade always comes around sooner or later.
A 100% equity portfolio has, historically, the highest expected return over the very long run — but it also requires the ability (financial, and above all psychological) to sit through drawdowns like 2000-2010 without selling in a panic. A more conservative allocation gives up some potential return in favourable periods, in exchange for a more sustainable ride through difficult ones.
Try these scenarios yourself
Want to see how a hypothetical portfolio of yours would have behaved in other historical periods, including more recent crises? Run a free simulation, no registration required.
Go to the ETF Backtest →